Quick Order – Analytics & Metrics
The Metrics section gives you a simple overview of how customers interact with your Quick Order pages. All metrics update based on the selected time range and store type (All / Default Store / B2B Store).
1. Active Users
Section titled “1. Active Users”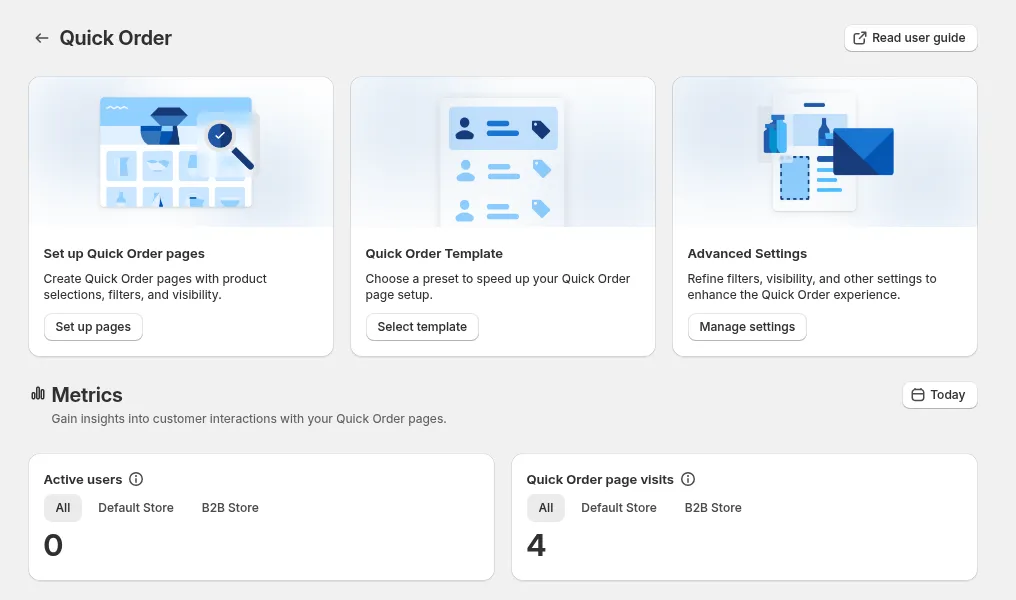
Definition:
The number of unique users who visited any Quick Order page during the selected time range.
How to use:
- Measures how many customers actually engage with Quick Order.
- Useful for tracking adoption over time.
- Compare Default Store vs B2B Store to understand usage by customer type.
Examples:
- If you choose “Last 7 days”, the number shows how many different users opened Quick Order at least once within those 7 days.
2. Quick Order Page Visits
Section titled “2. Quick Order Page Visits”Definition:
Total number of sessions (page visits) to all Quick Order pages during the selected time range.
How to use:
- Shows how frequently Quick Order pages are opened.
- Helps identify whether customers return multiple times.
- Differences between Active Users and Page Visits show intensity of usage.
Example:
- 10 active users and 40 visits → each user visited Quick Order ~4 times in that time range.
3. Time Range Filter
Section titled “3. Time Range Filter”Use the date selector (e.g., Today, Last 7 days, Last 30 days) to view metrics for a specific period.
Uses:
- Check short-term trends after new updates or campaigns.
- Understand long-term adoption by selecting larger time windows.
4. Store Type Filter (All / Default Store / B2B Store)
Section titled “4. Store Type Filter (All / Default Store / B2B Store)”All: combined metrics for both store types.
Default Store: standard Shopify storefront metrics.
B2B Store: interactions from Shopify B2B customers.
Why it matters:
- Helps compare how B2B customers use Quick Order vs normal customers.
- Useful when optimizing Quick Order specifically for B2B workflows.
Request for Quote – Analytics & Metrics
Section titled “Request for Quote – Analytics & Metrics”These metrics help you track how many quotes customers send and how many turn into orders.
1. Number of Quote Requests
Section titled “1. Number of Quote Requests”Definition:
Total number of quote requests submitted during the selected time range.
Includes:
- Quotes submitted through the storefront
- Quotes created manually in the admin
How to use:
- Evaluate RFQ adoption.
- Compare Default Store vs B2B Store to see which side drives more requests.
2. Quote-to-Order Conversion Rate
Section titled “2. Quote-to-Order Conversion Rate”Definition:
Percentage of quote requests in the selected time range that were converted into draft orders.
Formula:
Conversion Rate = (Quotes converted to draft orders ÷ Total quote requests) × 100%
How to use:
- Measures the effectiveness of your quote workflow.
- High conversion = strong pricing and negotiation flow.
- Low conversion = check response time, pricing strategy, or communication gaps.
3. Time Range Filter
Section titled “3. Time Range Filter”Select a date range (Today, Last 7 days, Last 30 days, etc.) to analyze RFQ performance within that timeframe.
4. Store Type Filter (All / Default Store / B2B Store)
Section titled “4. Store Type Filter (All / Default Store / B2B Store)”All: show combined metrics.
Default Store: requests from non-B2B customers.
B2B Store: requests from Shopify B2B Company/Location customers.
Use case:
- Compare how B2B buyers behave vs normal customers.
- Optimize quote logic and form fields based on user type.
Quick Interpretation Examples
Section titled “Quick Interpretation Examples”- Low Active Users + Low Visits (Quick Order)
→ Promote Quick Order more clearly; add navigation links or highlight benefits. - High Visits + Low Add-to-Cart (if measured)
→ Improve product scope, filters, search, or layout. - High Quote Requests + High Conversion
→ RFQ flow is performing very well. - High Quote Requests + Low Conversion
→ Check sales handling, pricing strategy, or customer communication.